Tuesday 29 November 2011

Investing explained well...

Well, wanted to write about the next candlestick pattern but just being lazy right now. My cousin is visiting me here in Singapore and we are watching www.bcci.tv for a delayed feed of India Vs West Indies one-dayer... what a harakiri by Indians.

Anyway, since I am not writing about candlestick pattern why not share ultimate secret of Stock Investing with you. So behold friends... all your questions and queries about investing are irrelevant and all you need is know this well kept and extremely guarded secret of stock markets.

This secret is exclusively bought to you by your friend... that is your's truly. Don't forget to thank me for this. Have a look at it here and let me know what you think of it.

Next post soon.

Saturday 12 November 2011

Candlestick Patterns - Evening Star / Evening Doji Star

It's been so long since I wrote here that I had to read my last post to get myself in the 'zone' again. I almost forgot what we were discussing here. Anyway, I am back to make a post here and that is important. Let's get on with that.

Evening Star

It is easy to guess that this patterns is opposite of Morning Star. Not enough innovation (thankfully) in naming these patterns. So Evening Star is a three candlestick bearish reversal pattern. It is found at the end of a uptrend. The first candle is a long white (or green) candle indicating a day belonging to bulls where stock saw the positive price movement as per the continuing trend. Second candle is again a white candle indicating another positive day but this time body is not as long and but the shadows are long indicating indecision in the market. Third day confirms the reversal by being a black (or red) candle indicating bears taking over control. See below.


as in the earlier post, the strength of the reversal is judged by two things. The volumes of the trade on the third day and the length of the black candle with respect to the white candle of the first day. If the black candle of the third day is reaching or going up more than the half of the first day white candle; it is considered very bearish.

Evening Doji Star

Evening Doji Star is as you can guess is similar to above pattern with only difference being the middle candle is a (black or white) Doji instead of a simple black candle. See below.


Evening Doji Star is considered a stronger bearish reversal pattern. One very important thing to note here is the second candle of Doji can be more than one. It can be one, two or even three Dojis in some cases.

Example of Evening Doji Star above is from the daily chart of CNX NIFTY Junior Index. The Evening Doji Star was formed around mid July at a level of approximately 11400. Since then it had corrected to a level of 9600 (more than 15% correction) by end August. Please excuse me for the bad graphics.

This is as far as Evening Star / Evening Doji Star. We will see Three White Soldiers / Three Black Crows next. Thanks for bearing with me in the meantime. I am still in Singapore with no clear input on when to return. Could be a month or so till I am stuck here. Have posted some snaps of Sentosa Island on FB.

Missing NIFTY here.

Candlestick Patterns - Morning Star / Morning Doji Star

Morning Star

Morning Star is a three candlestick bullish reversal pattern. It is found at the end of a downtrend. The first candle is a long black (or red) candle indicating a day belonging to bears where stock saw the negative price movement as per the continuing trend. Second candle is again a black candle indicating another negative day but this time body is not as long and but the shadows are long indicating indecision in the market. Third day confirms the reversal by being a white (or green) candle indicating bulls taking over control. See below.


The strength of the reversal is judged by two things. The volumes of the trade on the third day and the length of the white candle with respect to the black candle of the first day. If the white candle of the third day is reaching or going up more than the half of the first day black candle; it is considered very bullish.

Morning Doji Star

Morning Doji Star is as you can guess is similar to above pattern with only difference being the middle candle is a (black or white) Doji instead of a simple black candle. See below.


Morning Doji Star is considered a stronger bullish reversal pattern. Example of Morning Doji Star above is from the weekly chart of CNX IT Index. The Morning Doji Star was formed around August at a level of approximately 5100. Since then it had gone up to a level of 6300 (almost 25% gain) by mid October. What more can I say...

This is as far as Morning Star / Morning Doji Star. In the next post, we will see Evening Stars. In between these two... have a wonderful day.

Thursday 10 November 2011

Candlestick Patterns

I am back with Candlestick Patterns here. We have so far seen the Patterns formed by single candlesticks... Progressing further, it is now turn of Patterns created by multiple candlesticks. As I said in the previous post, these patters are stronger indicators.

Some of these popular Patterns are;
  • Morning Star / Morning Doji Star
  • Evening Star / Evening Doji Star
  • Three White Soldiers / Three Black Crows
  • Bullish / Bearish Engulfing
These comes to mind immediately. Will add more if relevant.

After getting through these Patterns, we will proceed to actual charts. Studying charts and fixing larger Patterns in the chart is a very very interesting thing and one of the mail reason I love Technical Analysis. Apart from Patterns on charts, what adds to the fun is a host of indicators and oscillators and I cannot wait to get to them.

More on above mentioned Patterns in next post.

Tuesday 8 November 2011

Candlestick Patterns - Marubozu and Spinning Top

Well, I am back with few more single Candlestick Patterns. As promised, these are not twins having different names. Let's look at them before we get to multi-candlestick patterns from next post.

Marubozu is pattern characterized by absence of horns or shadow on either side. It is basically a body only candlestick. White (or Green) Marubozu indicates that after the opening price bulls took control and remained winner throughout the trading session. It is obviously considered very bullish. On the other hand a Black (or Red) Marubozu is formed when sellers remain in control after the opening bell and close the price at it's lowest level of the day... it is very bearish. See below.


Spinning Top is what we call as classic text book candlestick. It consists of a body in the middle with almost similar size shadows on both sides. It usually indicates that market is unable to decide the trend. During the day, at some point, both bulls and bears had control but by the end of the day price was closing at or near the opening level again. It kind of indicates an indecision about the further trend of the underlying and if Spinning Top appears at the end of a long uptrend/ downtrend it usually indicates an exhaustion. It indicates that a reversal in the trend may be due now.


This is most that you can get about single candlestick patterns out there. These are pretty strong patterns in their own right but still multiple (2/3) candlestick patterns are stronger indicators and we will get to them next post onward. Keep hanging man...

Monday 7 November 2011

Candlestick Patterns - Inverted Hammer and Shooting Star

As promised... I am back with the next twin pattern - Inverted Hammer and Shooting Star.

As you can see, this pattern is basically Hammer and Hanging Man turned upside down. It has a small body which indicates close near to open and very small or non-existent lower horn. It's upper leg has to be at least twice the size of the body to meet the definition of Inverted Hammer or Shooting Star.

It indicates that though the price opened lower, it increased a lot as the day progressed but turning back again and close price is very close to open price (slightly lower or higher).

Inverted Hammer appears in a downtrend and it usually signifies the end of the current trend. In both these patterns; longer the upper shadow, better it is.


Shooting Star; similar to Hanging Man appears during the uptrend and it usually signals an impending end to the trend. Shooting Star is also quite similar in look to the notorious Gravestone Doji. However in case of Gravestone Doji, the opening and closing price are almost the same... meaning the body of the candlestick is not there and it is usually a stronger bearish reversal pattern than the Shooting Star. Gravestone Doji appearing in an uptrend signals bearish reversal and if appearing in an downtrend, it signals bullish reversal. It is all about Context as I said in the previous post. Meanwhile, see the example for Shooting Star below.


Next post will be a lot less confusing and it will be a pattern which is simple, does not have any twin sibling and extremely easy to identify. Wanted to write it today itself but have been called to office... someone onsite sneezed and I have to catch the cold. Will try to write it tonight and tomorrow tops.

Sunday 6 November 2011

Candlestick Patterns - Hammer and Hanging Man

Let us proceed to the next patterns. Let us have a look at the Hammer and Hanging Man...


You got 60 seconds to find 5 difference in above pictures apart from their names.
Can't seem to find... you are not to blame. Off course they are same and this is not the isolated case. There are a couple few more patterns which looks all the same. In Japanese Candlesticks, these similar looking patterns are differentiated with the help of context. It is the context in which these patterns appear which matter and it decides their name. Quite similar to words in English... ring any bell.

Hammer or Hanging Man patterns are characterized by a body at the top with non existent or very small upper horn. The lower horn has to be at least twice the size of the body of the candle for it to be classified as Hammer or Hanging Man. It shows that the price opened at the high point of the day and then during the day the price fell much lower and then it bounced back to close near the opening price (slightly above or below) again.

Hammer, occurs during a downtrend and it indicates that the reversal is due now. On the next trading day if stock opens higher, it is a very reliable sign that Hammer is confirmed and stock is coming out of downtrend. See below for example. Sorry for the low quality of image... just pulled out of some random chart I had.

Hanging Man on the other hand appears in the uptrend. It usually signals that bulls are running out of steam and during the day bears had almost taken control only to give it back to the bulls by the end of the day. Hanging Man is very reliable if next day we see a lower price. See below.

Next we will have a look at the Inverted Hammer or Shooting Star. It will be another 'Find the Difference' pattern for you and it will be posted on or before tomorrow... I promise. Visit Options Blog for a fresh post in a short while.

Tuesday 1 November 2011

Japanese Candlesticks - Patterns


We have seen basic candlestick construction in the previous post. As promised, I am back with some patterns in the candlesticks. These are slightly different than the chart patterns. When candle sticks charts (usually over a longer period) are analysed for trends with the help of some indicators/oscillators for the presence of some established patterns (trends, head and shoulders, double tops, etc), that time we are referring to the chart patterns.

However, candlestick patterns are usually analysed for a single candlestick. The candlestick being studied may be for a day/week or even month. These patterns tell us about strong trend, impending trend reversal or exhaustion of trend. Let us see them one by one.

We will be discussing;
  • ·         Doji
  • ·         Hammer
  • ·         Hanging Man
  • ·         Inverted Hammer
  • ·         Shooting Star
  • ·         Marubozu and
  • ·         Spinning Top

This should cover all that we need. After that we will see some very simple patterns which need more than one (2/3) candlestick to form… like bullish/bearish engulfing, morning star, three white soldiers or three black crows. Then we will proceed to chart patterns in the end.
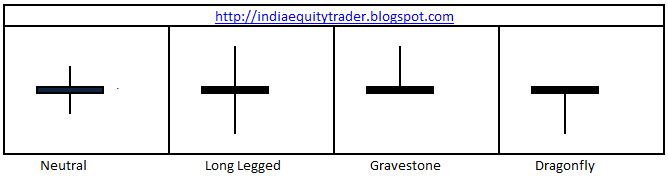
Doji:

As seen in the image above, Doji is formed when opening and closing price is almost equal. Doji themselves do not indicate much. They are mostly neutral patterns indicating indecision in the market. A long legged doji indicates higher amount of indecision with price fluctuating a lot on either sides during the period under consideration. It shows that both bulls and bears are slugging it out without any clear winner.

A gravestone or dragonfly Doji on the other hand indicates that there may be a trend reversal just around the corner in the prevalent trend of the underlying. They indicate that the direction of the trend may be in for a change which then needs to be confirmed with the multi-candlestick patterns which we will see in a few posts.

Candlesticks is one subject which though I read first time probably 5 years back; still continues to amaze and excite me. So there lies a risk that I may spend more than needed time on them. Please feel free to point it out if it’s happening or in case if you want more, do let me know. I will be more than happy to offer you candlelight posts... not dinner.

Stay tuned for other patterns.