Friday, 2 December 2011

Candlestick Patterns - Three White Soldiers / Three Black Crows

I am back. Been too busy exploring new city and visiting places and it is nothing short of wonder that I still find time to write. I must be addicted I guess. Will go to JM for rehab once I am back.

Coming back to the Candlestick Patterns... today it is turn of Three White Soldiers and Three Black Crows. Both these do not occur as often as the major reversal patterns and hence are called secondary patterns. Though uncommon (just like common sense) they are very strong and reliable indicators.

Three White Soldiers

Have a look at the pattern here.


This pattern is characterized by three consecutive White (Green) candles where each candle opens within the body of previous candle and closes above it. The close is usually at or near day's high. This pattern usually occurs at the end of a long down or sideways move.

First candle indicates the exhaustion of current trend by indicating a close near day's high. Second day the price opens lower indicating sellers are still present in the market but as the day progresses, buyers overwhelm them. This is repeated again on third day indicating a definitive trend reversal.

Three Black Crows

The Pattern.


In one sentence; this is Three Black Soldiers pattern.

It is named after crows probably because Japanese people think of crows as evil birds. Needless to say, this pattern appears after a long uptrend indicating the reversal. First day indicating the change in trend and second, third days indicating unsuccessful denial by buyers. This pattern is further strong if price closes at or near day's low.

I am not posting a example of these patterns here but will mention one. Around middle of March 09 when NIFTY was around 2550-2600 level after prolonged downtrend, Three White Soldiers appeared. What followed was one of the most spectacular bullish phase taking NIFTY to above 4600 by Mid Jun (over 2000 points in 3 months) and above 5000 by Nov.

Will come back soon with the final multi-candlestick pattern. Then we proceed to charts and patterns in them along with indicators and oscillators. Can't wait to get there. It will be fun for sure.

Will try to post one today at Options Blog and will try to revive Futures Blog too. Till then, enjoy rehab.

Tuesday, 29 November 2011

Investing explained well...

Well, wanted to write about the next candlestick pattern but just being lazy right now. My cousin is visiting me here in Singapore and we are watching www.bcci.tv for a delayed feed of India Vs West Indies one-dayer... what a harakiri by Indians.

Anyway, since I am not writing about candlestick pattern why not share ultimate secret of Stock Investing with you. So behold friends... all your questions and queries about investing are irrelevant and all you need is know this well kept and extremely guarded secret of stock markets.

This secret is exclusively bought to you by your friend... that is your's truly. Don't forget to thank me for this. Have a look at it here and let me know what you think of it.

Next post soon.

Saturday, 12 November 2011

Candlestick Patterns - Evening Star / Evening Doji Star

It's been so long since I wrote here that I had to read my last post to get myself in the 'zone' again. I almost forgot what we were discussing here. Anyway, I am back to make a post here and that is important. Let's get on with that.

Evening Star

It is easy to guess that this patterns is opposite of Morning Star. Not enough innovation (thankfully) in naming these patterns. So Evening Star is a three candlestick bearish reversal pattern. It is found at the end of a uptrend. The first candle is a long white (or green) candle indicating a day belonging to bulls where stock saw the positive price movement as per the continuing trend. Second candle is again a white candle indicating another positive day but this time body is not as long and but the shadows are long indicating indecision in the market. Third day confirms the reversal by being a black (or red) candle indicating bears taking over control. See below.


as in the earlier post, the strength of the reversal is judged by two things. The volumes of the trade on the third day and the length of the black candle with respect to the white candle of the first day. If the black candle of the third day is reaching or going up more than the half of the first day white candle; it is considered very bearish.

Evening Doji Star

Evening Doji Star is as you can guess is similar to above pattern with only difference being the middle candle is a (black or white) Doji instead of a simple black candle. See below.


Evening Doji Star is considered a stronger bearish reversal pattern. One very important thing to note here is the second candle of Doji can be more than one. It can be one, two or even three Dojis in some cases.

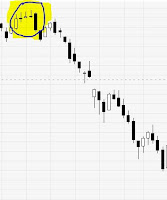
Example of Evening Doji Star above is from the daily chart of CNX NIFTY Junior Index. The Evening Doji Star was formed around mid July at a level of approximately 11400. Since then it had corrected to a level of 9600 (more than 15% correction) by end August. Please excuse me for the bad graphics.

This is as far as Evening Star / Evening Doji Star. We will see Three White Soldiers / Three Black Crows next. Thanks for bearing with me in the meantime. I am still in Singapore with no clear input on when to return. Could be a month or so till I am stuck here. Have posted some snaps of Sentosa Island on FB.

Missing NIFTY here.

Candlestick Patterns - Morning Star / Morning Doji Star

Morning Star

Morning Star is a three candlestick bullish reversal pattern. It is found at the end of a downtrend. The first candle is a long black (or red) candle indicating a day belonging to bears where stock saw the negative price movement as per the continuing trend. Second candle is again a black candle indicating another negative day but this time body is not as long and but the shadows are long indicating indecision in the market. Third day confirms the reversal by being a white (or green) candle indicating bulls taking over control. See below.


The strength of the reversal is judged by two things. The volumes of the trade on the third day and the length of the white candle with respect to the black candle of the first day. If the white candle of the third day is reaching or going up more than the half of the first day black candle; it is considered very bullish.

Morning Doji Star

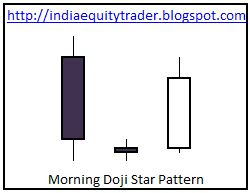
Morning Doji Star is as you can guess is similar to above pattern with only difference being the middle candle is a (black or white) Doji instead of a simple black candle. See below.


Morning Doji Star is considered a stronger bullish reversal pattern. Example of Morning Doji Star above is from the weekly chart of CNX IT Index. The Morning Doji Star was formed around August at a level of approximately 5100. Since then it had gone up to a level of 6300 (almost 25% gain) by mid October. What more can I say...

This is as far as Morning Star / Morning Doji Star. In the next post, we will see Evening Stars. In between these two... have a wonderful day.

Thursday, 10 November 2011

Candlestick Patterns

I am back with Candlestick Patterns here. We have so far seen the Patterns formed by single candlesticks... Progressing further, it is now turn of Patterns created by multiple candlesticks. As I said in the previous post, these patters are stronger indicators.

Some of these popular Patterns are;
  • Morning Star / Morning Doji Star
  • Evening Star / Evening Doji Star
  • Three White Soldiers / Three Black Crows
  • Bullish / Bearish Engulfing
These comes to mind immediately. Will add more if relevant.

After getting through these Patterns, we will proceed to actual charts. Studying charts and fixing larger Patterns in the chart is a very very interesting thing and one of the mail reason I love Technical Analysis. Apart from Patterns on charts, what adds to the fun is a host of indicators and oscillators and I cannot wait to get to them.

More on above mentioned Patterns in next post.

Tuesday, 8 November 2011

Candlestick Patterns - Marubozu and Spinning Top

Well, I am back with few more single Candlestick Patterns. As promised, these are not twins having different names. Let's look at them before we get to multi-candlestick patterns from next post.

Marubozu is pattern characterized by absence of horns or shadow on either side. It is basically a body only candlestick. White (or Green) Marubozu indicates that after the opening price bulls took control and remained winner throughout the trading session. It is obviously considered very bullish. On the other hand a Black (or Red) Marubozu is formed when sellers remain in control after the opening bell and close the price at it's lowest level of the day... it is very bearish. See below.


Spinning Top is what we call as classic text book candlestick. It consists of a body in the middle with almost similar size shadows on both sides. It usually indicates that market is unable to decide the trend. During the day, at some point, both bulls and bears had control but by the end of the day price was closing at or near the opening level again. It kind of indicates an indecision about the further trend of the underlying and if Spinning Top appears at the end of a long uptrend/ downtrend it usually indicates an exhaustion. It indicates that a reversal in the trend may be due now.


This is most that you can get about single candlestick patterns out there. These are pretty strong patterns in their own right but still multiple (2/3) candlestick patterns are stronger indicators and we will get to them next post onward. Keep hanging man...

Monday, 7 November 2011

Candlestick Patterns - Inverted Hammer and Shooting Star

As promised... I am back with the next twin pattern - Inverted Hammer and Shooting Star.

As you can see, this pattern is basically Hammer and Hanging Man turned upside down. It has a small body which indicates close near to open and very small or non-existent lower horn. It's upper leg has to be at least twice the size of the body to meet the definition of Inverted Hammer or Shooting Star.

It indicates that though the price opened lower, it increased a lot as the day progressed but turning back again and close price is very close to open price (slightly lower or higher).

Inverted Hammer appears in a downtrend and it usually signifies the end of the current trend. In both these patterns; longer the upper shadow, better it is.


Shooting Star; similar to Hanging Man appears during the uptrend and it usually signals an impending end to the trend. Shooting Star is also quite similar in look to the notorious Gravestone Doji. However in case of Gravestone Doji, the opening and closing price are almost the same... meaning the body of the candlestick is not there and it is usually a stronger bearish reversal pattern than the Shooting Star. Gravestone Doji appearing in an uptrend signals bearish reversal and if appearing in an downtrend, it signals bullish reversal. It is all about Context as I said in the previous post. Meanwhile, see the example for Shooting Star below.


Next post will be a lot less confusing and it will be a pattern which is simple, does not have any twin sibling and extremely easy to identify. Wanted to write it today itself but have been called to office... someone onsite sneezed and I have to catch the cold. Will try to write it tonight and tomorrow tops.

Sunday, 6 November 2011

Candlestick Patterns - Hammer and Hanging Man

Let us proceed to the next patterns. Let us have a look at the Hammer and Hanging Man...


You got 60 seconds to find 5 difference in above pictures apart from their names.
Can't seem to find... you are not to blame. Off course they are same and this is not the isolated case. There are a couple few more patterns which looks all the same. In Japanese Candlesticks, these similar looking patterns are differentiated with the help of context. It is the context in which these patterns appear which matter and it decides their name. Quite similar to words in English... ring any bell.

Hammer or Hanging Man patterns are characterized by a body at the top with non existent or very small upper horn. The lower horn has to be at least twice the size of the body of the candle for it to be classified as Hammer or Hanging Man. It shows that the price opened at the high point of the day and then during the day the price fell much lower and then it bounced back to close near the opening price (slightly above or below) again.

Hammer, occurs during a downtrend and it indicates that the reversal is due now. On the next trading day if stock opens higher, it is a very reliable sign that Hammer is confirmed and stock is coming out of downtrend. See below for example. Sorry for the low quality of image... just pulled out of some random chart I had.

Hanging Man on the other hand appears in the uptrend. It usually signals that bulls are running out of steam and during the day bears had almost taken control only to give it back to the bulls by the end of the day. Hanging Man is very reliable if next day we see a lower price. See below.

Next we will have a look at the Inverted Hammer or Shooting Star. It will be another 'Find the Difference' pattern for you and it will be posted on or before tomorrow... I promise. Visit Options Blog for a fresh post in a short while.

Tuesday, 1 November 2011

Japanese Candlesticks - Patterns


We have seen basic candlestick construction in the previous post. As promised, I am back with some patterns in the candlesticks. These are slightly different than the chart patterns. When candle sticks charts (usually over a longer period) are analysed for trends with the help of some indicators/oscillators for the presence of some established patterns (trends, head and shoulders, double tops, etc), that time we are referring to the chart patterns.

However, candlestick patterns are usually analysed for a single candlestick. The candlestick being studied may be for a day/week or even month. These patterns tell us about strong trend, impending trend reversal or exhaustion of trend. Let us see them one by one.

We will be discussing;
  • ·         Doji
  • ·         Hammer
  • ·         Hanging Man
  • ·         Inverted Hammer
  • ·         Shooting Star
  • ·         Marubozu and
  • ·         Spinning Top

This should cover all that we need. After that we will see some very simple patterns which need more than one (2/3) candlestick to form… like bullish/bearish engulfing, morning star, three white soldiers or three black crows. Then we will proceed to chart patterns in the end.

Doji:

As seen in the image above, Doji is formed when opening and closing price is almost equal. Doji themselves do not indicate much. They are mostly neutral patterns indicating indecision in the market. A long legged doji indicates higher amount of indecision with price fluctuating a lot on either sides during the period under consideration. It shows that both bulls and bears are slugging it out without any clear winner.

A gravestone or dragonfly Doji on the other hand indicates that there may be a trend reversal just around the corner in the prevalent trend of the underlying. They indicate that the direction of the trend may be in for a change which then needs to be confirmed with the multi-candlestick patterns which we will see in a few posts.

Candlesticks is one subject which though I read first time probably 5 years back; still continues to amaze and excite me. So there lies a risk that I may spend more than needed time on them. Please feel free to point it out if it’s happening or in case if you want more, do let me know. I will be more than happy to offer you candlelight posts... not dinner.

Stay tuned for other patterns.

Wednesday, 26 October 2011

Charts - Japanese Candlesticks

As I said, I am back with the charts. Those of you who do not have ant Technical Analysis (TA) introduction, charts may seem like strange alien entities. However every chart communicates with you and all you need to do is understand their language.

Let us first see what are the popular types of aliens…err, I mean charts. Those of us who have had some Excel exposure (who doesn't have) know the basics like Line charts, Bar charts (slightly different here), Pie charts (not applicable for stocks) and other. However from any chart for Index or Stock we need some information more than just the closing price. For a stock or index; its opening price, closing price, high/low price of the day and even volume of trade are very essential to properly analyse it.

This criterion shortens the list from many available chart types. A modified Bar chart called OHLC (Open-High-Low-Close… can’t be more obvious) and P&F (Point and Figure) charts fit the bill but what takes the cake and is most popular is Japanese Candlesticks. We will be using only these charts and only talk about them here… any of you interested in knowing more about other types, ping me.

Japanese Candlesticks:

Candlesticks are basically shapes as shown below. It consists of the body and two (each on either side - up and down) horns. There are two types of Candlesticks; One where the body is unfilled and other where the body is completely shaded. Unfilled body is used on positive day (where closing price is greater than opening price) and so by default, shaded body is used to depict a negative day where closing price is lower than opening price. Two horns on either side show the highest price (upside) and lowest price (downside) of the day.


This is as basic about them as we can get. More on these charts and their use in identifying basic trends as well as some basic sticks like doji, hammer, etc in next post. Taking cue from here, will post about finding Support and Resistances using these charts in Options Blog.

Before closing, I wish all of you and your loved ones a Very Happy, Joyous, Prosperous and Safe Diwali. Have a rocking time.

Sunday, 23 October 2011

Approaches to Equities - Fundamental and Technical


Welcome back friends… it’s been unusually long overdue to write something here. Let’s talk about that and pleasantries can wait.

Well, to start from the very basic, there are two different roads one can take to start trading equities and I mean serious trading. One can simply have few friends giving tips, all those TV anchors acting as messiahs can also help, you can have hunch, dream or a thousand other ways to trade but if you seriously want to be responsible for your own decisions and money then you can take two approaches. You can analyse equities with the help of Fundamental Analysis or Technical Analysis. There is nothing right or wrong with any of this approach and in fact most of the time; most of the traders use both to complement each other.

Fundamental Analysis involves hosts of things including studying Balance Sheet, P&L Accounts, Cash Flow, Income Statements, Results, P/E Ratios, Return on Capital/Equity, etc. Then you also study the sector in which the company operates, short term, long term prospects of the sector, cyclical nature of sector. Next thing you turn to the economy in general, economy of the geography where company operates, country’s economy and now a days world economy too. You also get into analysing the competitors and their progress vis-à-vis the company you are interested in and it does not stop here. You can also factor in political (in)stability, approaching federal budget, policy announcements and virtually everything that can have any trace of effect on the stock. Sounds complicated… it isn’t. There are ways to simplify things a ton.

Technical Analysis, on the other hand, assumes that all these factors and everything else (like zodiac signs, astronomical alignments, etc.) are all factored in in the price of the stock. So if you simply see the price movement of the stock, all these things and their impact is already present there. Another baseline assumption here is that prices tend to follow some patterns and these patterns are repetitive in nature. So sometimes stock may follow one particular pattern and some other time the pattern may be of different kind. If you have some experience in TA (Technical Analysis off course) then you can identify these patterns and trade with them.

In short, TA assumes that Price factors in everything, Price tends to move in patterns and which are repetitive in nature. These three basic assumptions are the key to the whole field of TA.

Some subtle difference between Fundamental (FA) and Technical (TA) approaches are;
  • FA needs lot of financial data usually for multiple years but TA can just do about with price (and volume) variation over the time.
  • The data needed for FA is not published daily and is available usually every quarter while TA has data updated every second when the market is open.
  • Due to its inherent nature, FA is mostly used for long term decisions (investing). TA however can be used for decisions for years, months, weeks or even intraday. While TA is used mainly for trading, it can also be used for investing.

There are supporters and critics of each of these approaches but also there are critics who criticize both these approaches. The later lot emphasize their arguments against both FA and TA based on EfficientMarket Hypothesis (EMH). I will not get into details of that; it will probably need a blog of its own.

Obviously, my Technical Background forbids me to talk about FA first and hence we will discuss TA in details. Next post on types of charts in general and candle-sticks in particular.

Monday, 26 September 2011

Coming Soon...

Friends, my posts on basics of Options at NSE Options Trader are coming to a intermediate close. I intend to start writing on basics of Futures at NSE Futures Trader immediately after that. In all likelihood you will see posts starting on that blog as early as this weekend. Posts on this blog are not far behind.

Stay tuned for more.

Saturday, 10 September 2011

About Myself...

I am a typical investor who is not satisfied with copy book 9 to 6 job and want to dabble with being an active trader. My lust for investment does not stop at Mutual Funds or Shares as in other 90% cases and I graduated (read: want to graduate) to a derivative trader.

I have started by getting in to options first. You may want to visit NSE Options Trader to check out how am I doing.

Surprisingly enough, but since you are anyway on this page, wish me luck.