Monday, 7 November 2011

Candlestick Patterns - Inverted Hammer and Shooting Star

As promised... I am back with the next twin pattern - Inverted Hammer and Shooting Star.

As you can see, this pattern is basically Hammer and Hanging Man turned upside down. It has a small body which indicates close near to open and very small or non-existent lower horn. It's upper leg has to be at least twice the size of the body to meet the definition of Inverted Hammer or Shooting Star.

It indicates that though the price opened lower, it increased a lot as the day progressed but turning back again and close price is very close to open price (slightly lower or higher).

Inverted Hammer appears in a downtrend and it usually signifies the end of the current trend. In both these patterns; longer the upper shadow, better it is.


Shooting Star; similar to Hanging Man appears during the uptrend and it usually signals an impending end to the trend. Shooting Star is also quite similar in look to the notorious Gravestone Doji. However in case of Gravestone Doji, the opening and closing price are almost the same... meaning the body of the candlestick is not there and it is usually a stronger bearish reversal pattern than the Shooting Star. Gravestone Doji appearing in an uptrend signals bearish reversal and if appearing in an downtrend, it signals bullish reversal. It is all about Context as I said in the previous post. Meanwhile, see the example for Shooting Star below.


Next post will be a lot less confusing and it will be a pattern which is simple, does not have any twin sibling and extremely easy to identify. Wanted to write it today itself but have been called to office... someone onsite sneezed and I have to catch the cold. Will try to write it tonight and tomorrow tops.

Sunday, 6 November 2011

Candlestick Patterns - Hammer and Hanging Man

Let us proceed to the next patterns. Let us have a look at the Hammer and Hanging Man...


You got 60 seconds to find 5 difference in above pictures apart from their names.
Can't seem to find... you are not to blame. Off course they are same and this is not the isolated case. There are a couple few more patterns which looks all the same. In Japanese Candlesticks, these similar looking patterns are differentiated with the help of context. It is the context in which these patterns appear which matter and it decides their name. Quite similar to words in English... ring any bell.

Hammer or Hanging Man patterns are characterized by a body at the top with non existent or very small upper horn. The lower horn has to be at least twice the size of the body of the candle for it to be classified as Hammer or Hanging Man. It shows that the price opened at the high point of the day and then during the day the price fell much lower and then it bounced back to close near the opening price (slightly above or below) again.

Hammer, occurs during a downtrend and it indicates that the reversal is due now. On the next trading day if stock opens higher, it is a very reliable sign that Hammer is confirmed and stock is coming out of downtrend. See below for example. Sorry for the low quality of image... just pulled out of some random chart I had.

Hanging Man on the other hand appears in the uptrend. It usually signals that bulls are running out of steam and during the day bears had almost taken control only to give it back to the bulls by the end of the day. Hanging Man is very reliable if next day we see a lower price. See below.

Next we will have a look at the Inverted Hammer or Shooting Star. It will be another 'Find the Difference' pattern for you and it will be posted on or before tomorrow... I promise. Visit Options Blog for a fresh post in a short while.

Tuesday, 1 November 2011

Japanese Candlesticks - Patterns


We have seen basic candlestick construction in the previous post. As promised, I am back with some patterns in the candlesticks. These are slightly different than the chart patterns. When candle sticks charts (usually over a longer period) are analysed for trends with the help of some indicators/oscillators for the presence of some established patterns (trends, head and shoulders, double tops, etc), that time we are referring to the chart patterns.

However, candlestick patterns are usually analysed for a single candlestick. The candlestick being studied may be for a day/week or even month. These patterns tell us about strong trend, impending trend reversal or exhaustion of trend. Let us see them one by one.

We will be discussing;
  • ·         Doji
  • ·         Hammer
  • ·         Hanging Man
  • ·         Inverted Hammer
  • ·         Shooting Star
  • ·         Marubozu and
  • ·         Spinning Top

This should cover all that we need. After that we will see some very simple patterns which need more than one (2/3) candlestick to form… like bullish/bearish engulfing, morning star, three white soldiers or three black crows. Then we will proceed to chart patterns in the end.

Doji:

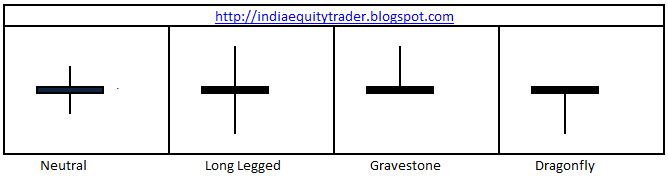
As seen in the image above, Doji is formed when opening and closing price is almost equal. Doji themselves do not indicate much. They are mostly neutral patterns indicating indecision in the market. A long legged doji indicates higher amount of indecision with price fluctuating a lot on either sides during the period under consideration. It shows that both bulls and bears are slugging it out without any clear winner.

A gravestone or dragonfly Doji on the other hand indicates that there may be a trend reversal just around the corner in the prevalent trend of the underlying. They indicate that the direction of the trend may be in for a change which then needs to be confirmed with the multi-candlestick patterns which we will see in a few posts.

Candlesticks is one subject which though I read first time probably 5 years back; still continues to amaze and excite me. So there lies a risk that I may spend more than needed time on them. Please feel free to point it out if it’s happening or in case if you want more, do let me know. I will be more than happy to offer you candlelight posts... not dinner.

Stay tuned for other patterns.